"Defenders think in lists, attackers think in graphs; as long as this is true, attackers win." is a popular quote attributed to John Lambert. It illustrates the challenges of defending large, ever-evolving environments: attackers typically follow "attack paths", compromising an initial workload and pivoting from there.
KubeHound builds a vizualization of attack paths in your cluster, allowing you to identify weaknesses and potential attack paths so that you can focus on remediating them.
How KubeHound works
KubeHound starts by connecting to the API server of your Kubernetes cluster. It then computes attack paths, and stores the result into a graph database, JanusGraph.

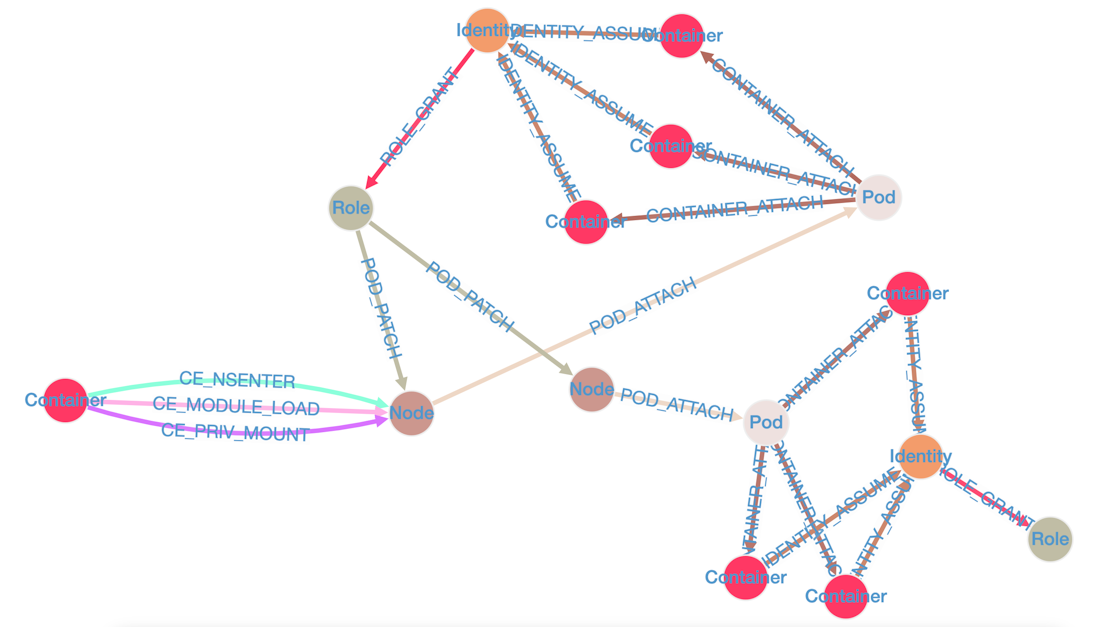
You can then vizualize and query attack paths, from an UI or using the Gremlin query language:

Each node (vertex) corresponds to an entity such as a pod, volume, or container. Each edge corresponds to a possible step that an attacker can take to move from this entity to another one. More than [25 types of attacks] are supported.
For instance, in the graph above, the leftmost container runs with hostPID: true and privileged: true, allowing an attacker who compromised it to escape to the underlying worker node. The associated KubeHound documentation of the CE_NSENTER attack explains in detail:
- The situation in which a container is vulnerable
- A sample pod definition that defines a vulnerable container
- How to exploit such a weakness step by step
Maintainers
KubeHound was created by Datadog's Adversary Simulation Engineering team, and is used internally at Datadog.
Video: KubeHound presentation
Watch author and maintainer Jeremy Fox present KubeHound at VetSecCon '23.
